. 2017 Apr 27;8(7):4967–4972. doi: 10.1039/c7sc00873b

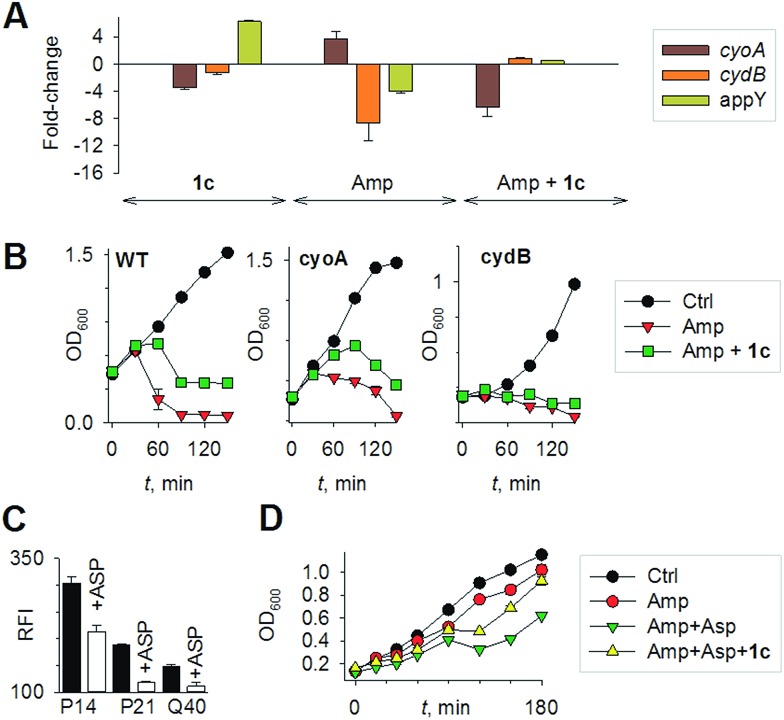
Fig. 4. (a) qRT-PCR analysis of E. coli cells treated with 1c alone, Amp alone. The fold-change is with respect to untreated control; 1c + Amp where fold-change is with respect to Amp-treated cells. Fold change for each transcript was calculated by normalizing expression with the housekeeping 16SrRNA transcript. A 2-fold (p < 0.05) increase or decrease in expression was considered significant in all cases. (b) Growth curves of E. coli treated with Amp (5 μg mL–1) with and without 1c (100 μM); Ctrl is untreated bacteria: wild-type (WT); cyoA mutant; cydB mutant. (c) H2S levels measured using the H2S-sensitive dye 4a in the presence of ASP, a biosynthesis inhibitor of H2S generation (d) bacterial growth measurements: Amp (100 μg mL–1); Asp (4 mM) and 1c (100 μM) were used in this study.

Fig. 4