
Figure 4.
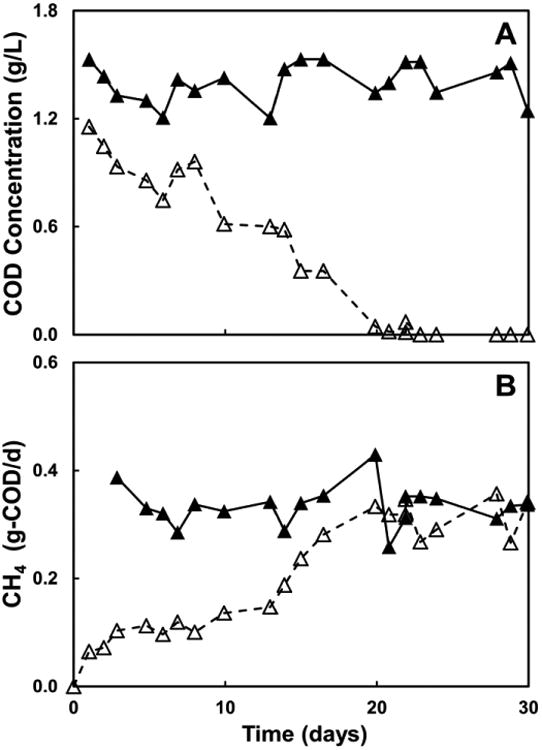
(Panel A) COD concentration in the influent (▲) and effluent (Δ) of the methanogenic column (pH 6.71± 0.19). (Panel B) Daily production of methane as a function of the operation time: (▲), maximum expected concentration based on the amount of COD added to the influent; (Δ), daily measured production.