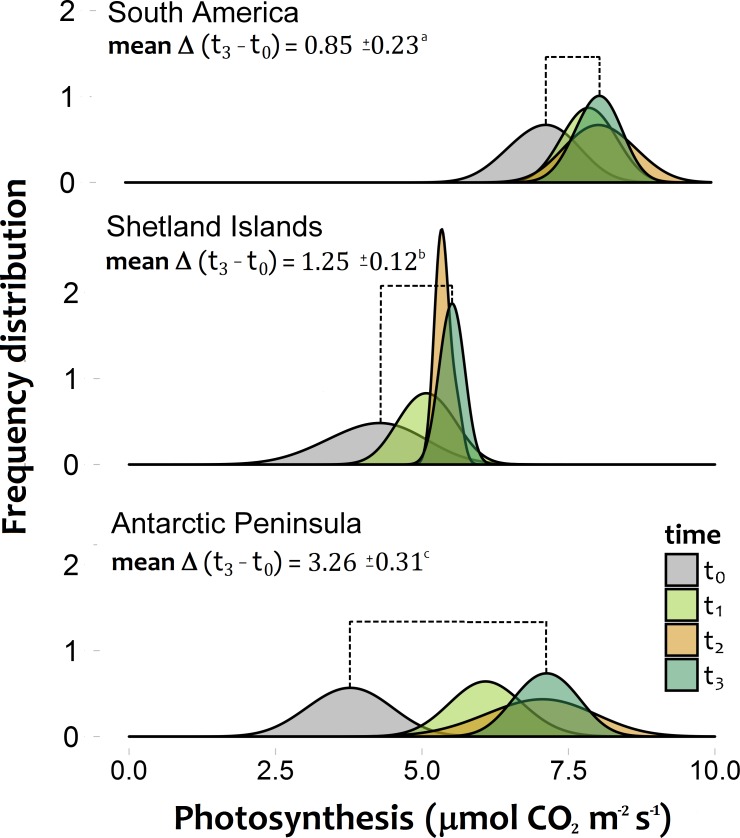
Figure 2. Frequency distribution of the photosynthetic response of Colobanthus quitensis individuals from three different origins (South America 53.5°S, Shetland Islands 62.1°S and Antarctic Peninsula 67.5°S).
Estimations were performed under both the current thermal conditions of each site (t0), and during three consecutive simulated growing seasons (t1:t3), where all individuals experienced their respective projected temperatures. The extent of the mean temporal response for each population is expressed as the mean delta value (±SD) between the photosynthetic responses at the last simulated warming season (t3) and their values under the current thermal conditions (t0). Different letters between these values refer to significant differences (Tukey HSD tests, α = 0.05) between populations. Bonferroni correction was applied due to multiple comparisons.

