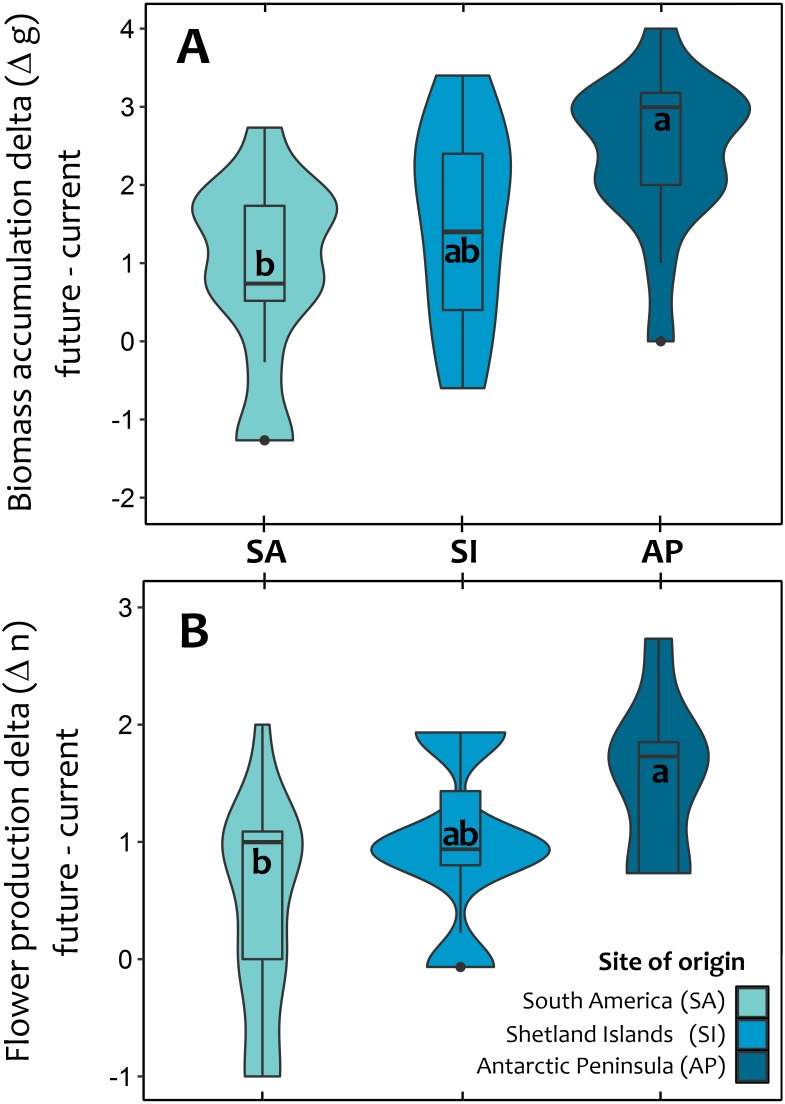
Figure 3. Violin plot for the average response of Colobanthus quitensis from three different latitudinal origins: South America (SA: 53.5°S), Shetland Islands (SI: 62.1°S) and Antarctic Peninsula (AP: 67.5°S) to experimental warming.
The effects of warming (+4 °C) were estimated as the absolute difference (i.e., delta) between plant performance under warming (simulated future conditions) and current thermal conditions in two fitness-related traits: aboveground biomass accumulation delta in grams (A) and reproductive effort delta estimated as the number of produced flowers (B). The mean delta value for each population in both traits was obtained after averaging the mean differences of each individual against all other plants from the same population. The box and whisker plot inside the violins represent the interquartile distribution of the data around the median (box inner line). Black dots correspond to outlier values. Different letters indicate significant differences (Tukey HSD tests, a = 0.05) between populations.

