
Figure 5. Validation of the differentially expressed miRNAs in BAL cells by individual qPCR.
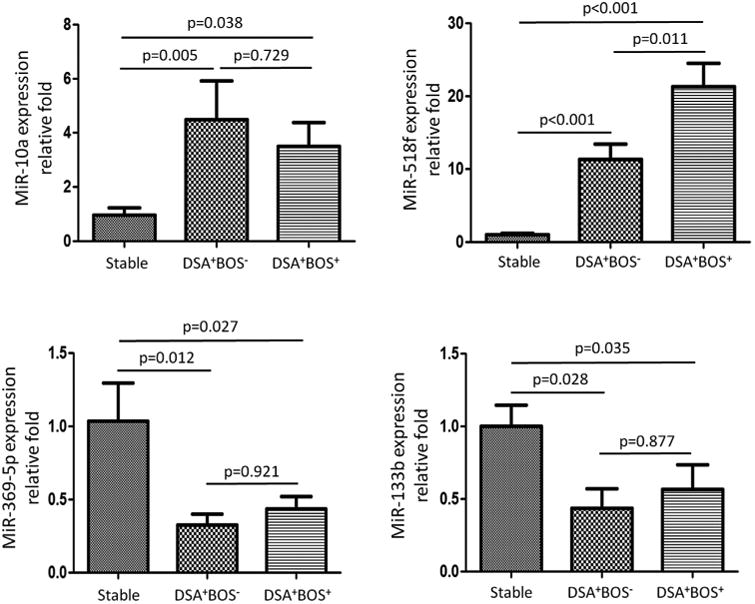
Quantitative expression of miR-518f, miR-10a, miR-369-5p, and miR-133b was evaluated by TaqMan RT-PCR in RNA samples of BAL cells from 9 stable LT recipients, 7 LT recipients with DSA+BOS−, and 10 DSA+BOS+ LT recipients. The delta Ct values were calculated by using RNU44 as the endogenous control. The Mann-Whitney test was performed to determine the significance of miRNA levels of BAL cells. Bonferroni procedure was used to calculate adjusted p values to control FDR among stable, DSA+BOS− and DSA+BOS+ patient groups, respectively.