Figure 2.

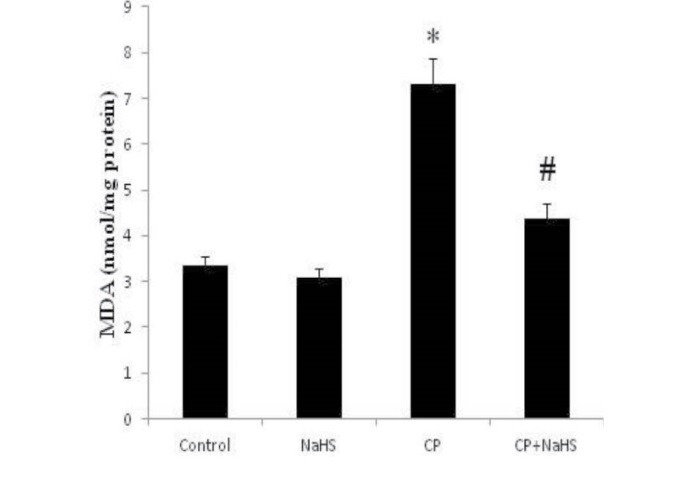
Effects of NaHS on CP- induced on MDA level alterations in renal tissue of different groups. Data are expressed as mean ± SD, *P < 0.001 compared to A and B groups, # P < 0.001 compared to CP-treated group (C).

Effects of NaHS on CP- induced on MDA level alterations in renal tissue of different groups. Data are expressed as mean ± SD, *P < 0.001 compared to A and B groups, # P < 0.001 compared to CP-treated group (C).