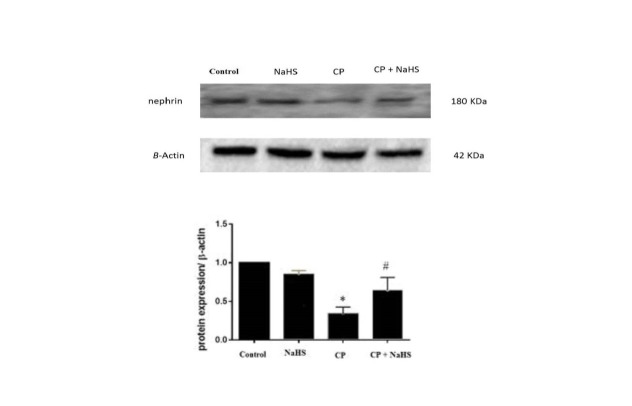
Figure 4.
Effects of NaHS on nephrin protein expressions in different groups. Western blot showed that the CP group had lower expressions. In addition, compared with CP group, nephrin expression was up-regulated after NaHS treatment. Data were expressed as means ± P < 0.05 compared with the normal control and NaHS groups, # P < 0.05 compared with CP group.

