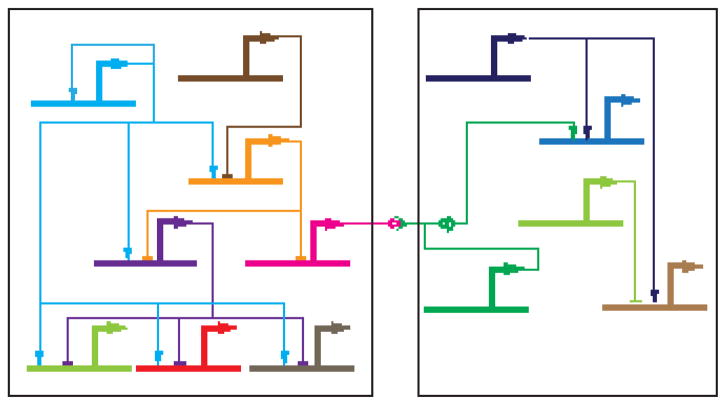
Figure 1. A gene regulatory network.
A hypothetical GRN functioning in two cells is shown. Heavy lines indicate CRMs and lighter-weight lines TF-DNA or protein-protein interactions (→, transcriptional activation; —|, transcriptional repression; —o>—, ligand-receptor binding; —o)— signal transduction process; see [62]). The TF represented by light blue coloring at the upper left is a “master regulator” whose activity impinges on the expression of many other genes in the network, including its own via autoregulation. For an introduction to GRNs, see Levine and Davidson [63].

