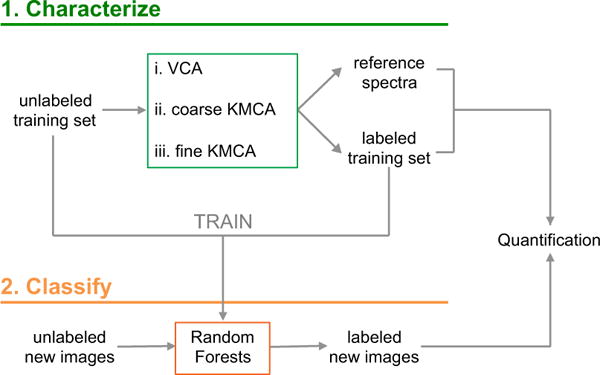
Figure 1.

Methodology implemented to quantify hyperspectral SRS images. In a first step, the data are characterized by unsupervised multivariate analysis based on vertex component analysis (VCA) k-means clustering analysis (KMCA). The outcome of the first step is used to train a random forests classifier, which is later used to describe the rest of the data set. The final labeled images are further used for quantification purposes.
