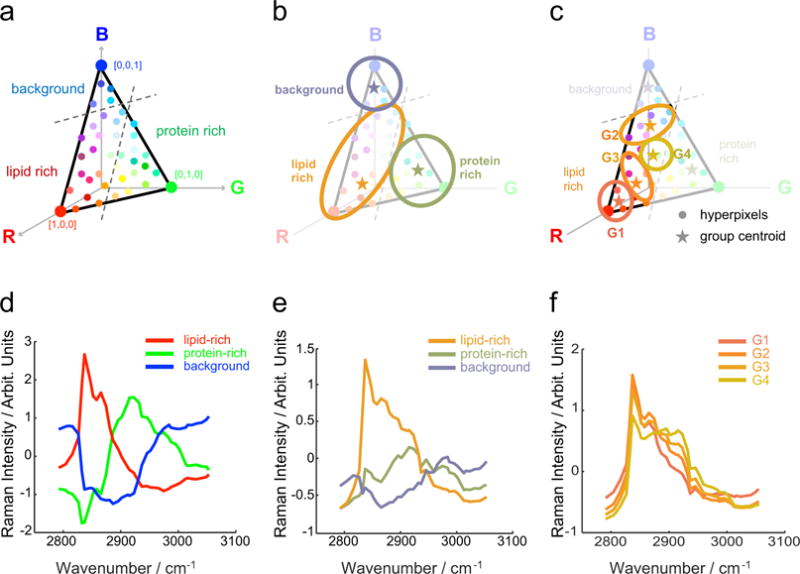
Figure 2.

Multivariate analysis characterized the chemical composition of meibum samples. a,d) Vertex component analysis (VCA) is used to describe the spectra in terms of three end members, each one assigned to an RGB base color. b,e) K-means clustering analysis (KMCA) groups the VCA output by color similarities and provides biochemical meaningful reference spectra. c,f) A nested KMCA within the lipid-rich group of the previous KMCA unveils extra grouping relevant to the meibum samples.
