Figure 3.

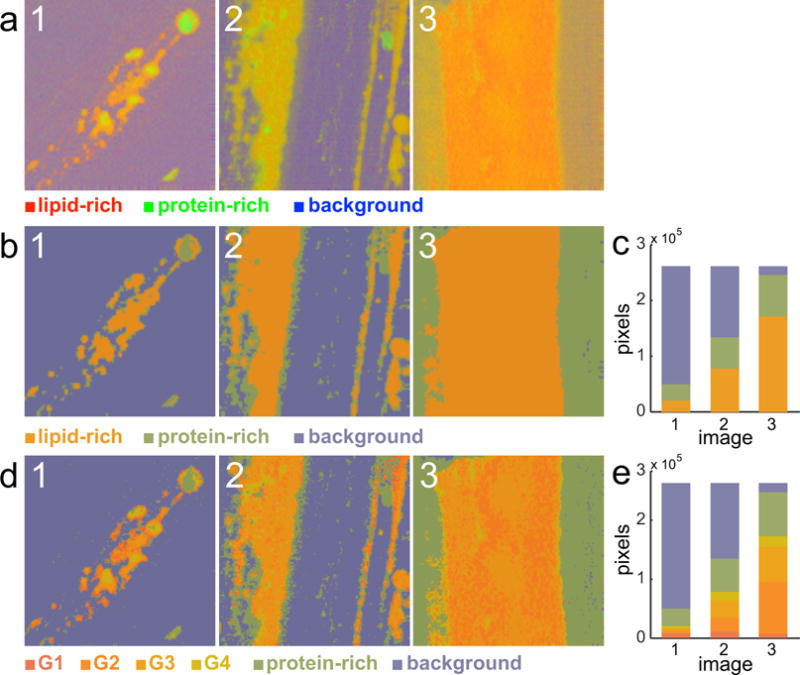
Characterization of the training set. a) Result of applying vertex component analysis (VCA) on three representative images in the training set. b) Result of applying the coarse K-means clustering analysis (KMCA) on the previous images and c) corresponding histogram quantification. d) Final result after applying the fine KMCA on the images and e) corresponding histogram quantification. Image size is 235.5 × 235.5 μm.
