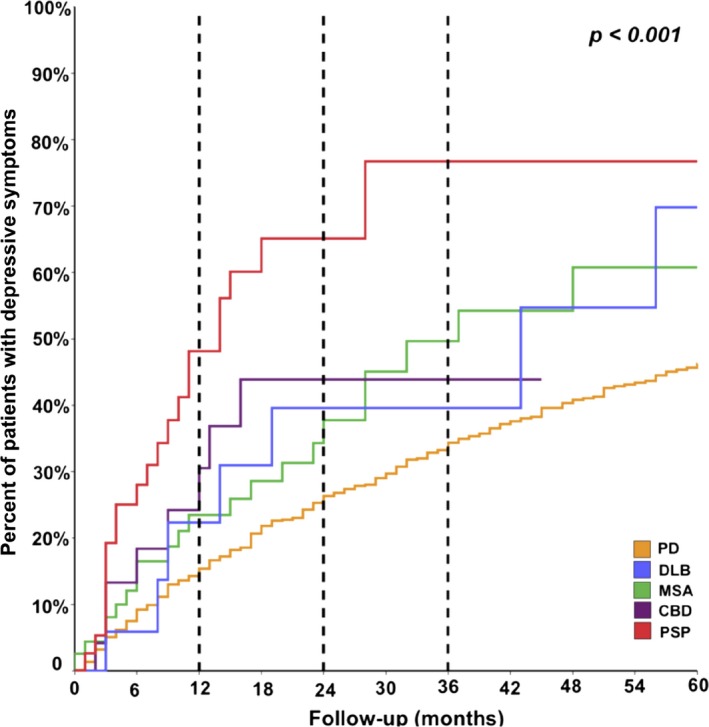
Figure 2.

Comparison of the cumulative incidence of newly diagnosed depressive symptoms over follow‐up (in months). Dashed lines indicate differences between the cumulative incidence across different disorders at 1, 2, and 3 years of follow‐up. PD, Parkinson's disease; DLB, dementia with Lewy bodies; MSA, multiple system atrophy; CBD, corticobasal degeneration; PSP, progressive supranuclear palsy.
