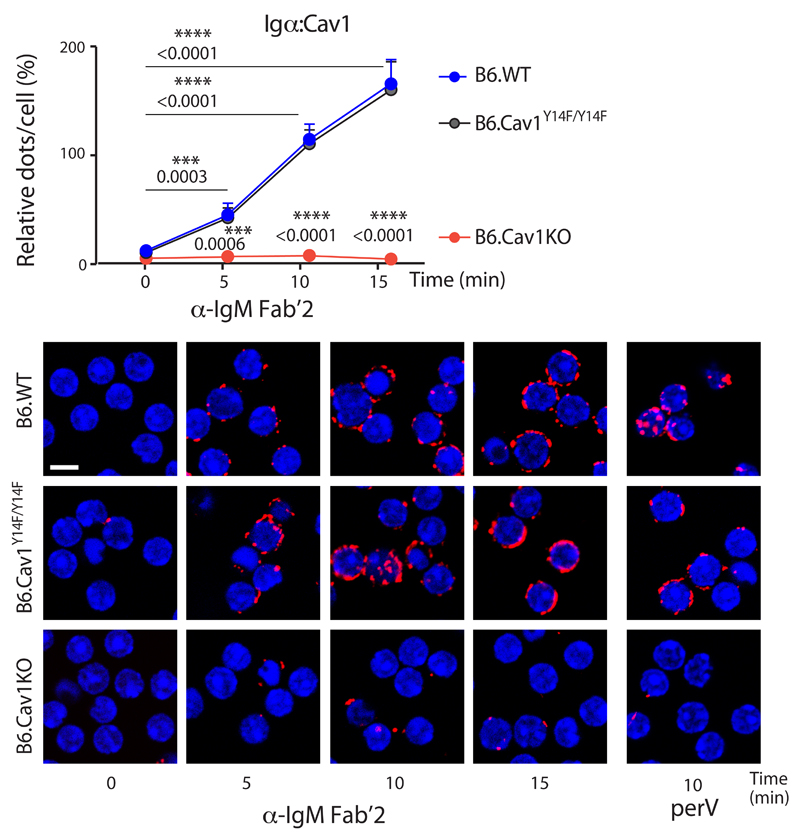
Figure 2. Cav1 and the BCR get in close proximity upon BCR stimulation.
Purified splenic B cells were stimulated with 10 μg/ml of anti-IgM Fab‘2 for the indicated times or left unstimulated. Cells were fixed, permeabilized and in situ PLA analyzes the proximity between the Igα cytoplasmic tail and Cav1. PLA signals (red dots per cell) were counted and normalized to the PLA signals of perV-stimulated B6.WT cells for each individual experiment. Representative microscope images show DAPI stained nuclei (in blue) and PLA signals (in red). Five independent experiments were pooled and statistical analysis performed using Student’s t-test. Means ± SEM are shown. P values between resting and stimulated B6.WT cells, and between B6.WT and B6.CavKO samples are indicated. At least 300 cells were quantified per experimental condition and experiment. Size bar 5 μm.

