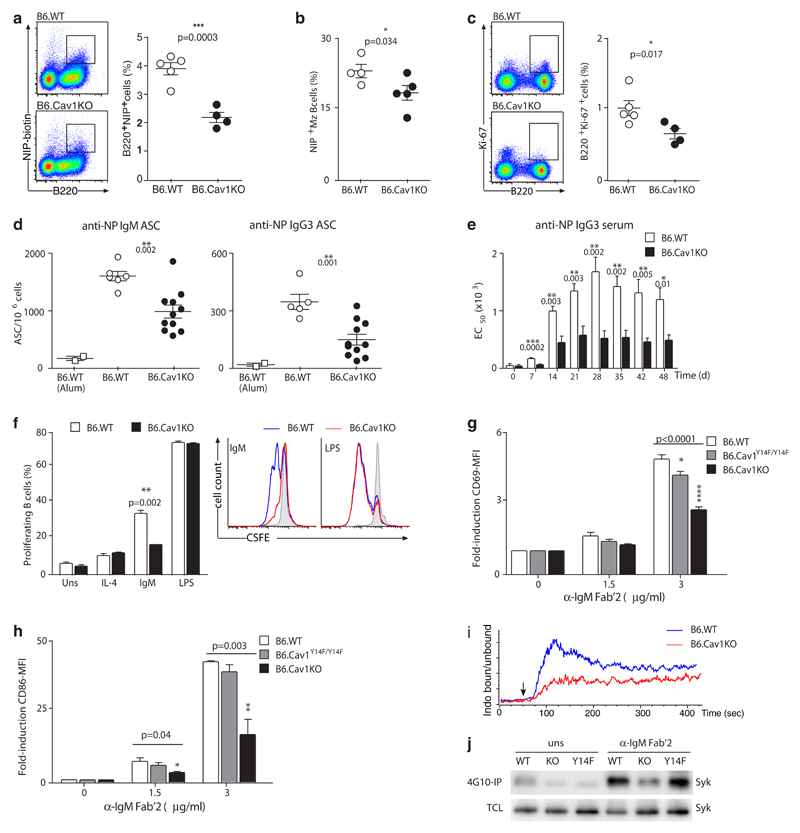
Figure 3. Absence of Cav1 reduces B cell responses in B6.CavKO mice.
(a) B6.WT and B6.CavKO mice were immunized with alum-precipitated NP-Ficoll. Splenocytes were analyzed for the frequency of NP-reactive B cells. Representative dot plots and the Mean ± SEM from 4-5 mice per group are shown. (b) NP-reactive Marginal zone (Mz) B cells and (c) the frequency of proliferating Ki-67+ B cells were analyzed. Representative dot plots and quantification plotted as in a are shown. (d) ELISPOT analysis of splenic NP-specific IgM-secreting cells (left) and NP-specific IgG3-secreting cells (right) 7 days after immunization with alum-precipitated NP-Ficoll. B6.WT mice injected only with Alum served as a control. Data of two independent experiments were pooled, and the mean ± SEM from 6-11 mice per group is shown. (e) ELISA of NP-specific IgG3 from NP-Ficoll immunized mice. Serial dilutions of the serum were performed and the EC50 for each mouse calculated. (f) CSFE-labeled splenic B cells were stimulated with IL-4 (50 ng/ml) alone or in combination with 3 μg/ml anti-IgM Fab’2, 1 μg/ml LPS or were left untreated (grey shaded in the representative histogram). After 3 days, the proliferation-induced dilution of the CFSE dye was measured by flow cytometry. Data are representative of 2 independent experiments. (g and h) Purified splenic B cells were stimulated 18 hours and then analyzed for CD69 (g) and CD86 (h) expression by flow cytometry. Quantification shows pooled data from 2 independently performed experiments. ANOVA test was used to compare B6.Cav1KO and B6.Cav1Y14F to B6.WT samples; Dunnett's multiple comparisons P values are indicated on the top of the corresponding bar. (i) Calcium flux was measured by flow cytometry. Baseline was acquired for 50 sec, and then 8 μg/ml of α-IgM Fab’2 fragments were added (arrow, n=2). (j) Purified B cells were stimulated with 10 μg/ml anti-IgM Fab’2 for 5 min or left unstimulated. Cells were lysed, an aliquot of the total cellular lysate (TCL) kept and the rest of the lysate incubated with 4G10-coupled beads overnight. Proteins were then separated by SDS-PAGE and Syk detected by immunoblot (n=3). At least otherwise indicated, statistical analysis was performed using unpaired Student’s t-test. Means ± SEM are shown. P values are indicated in each panel.

