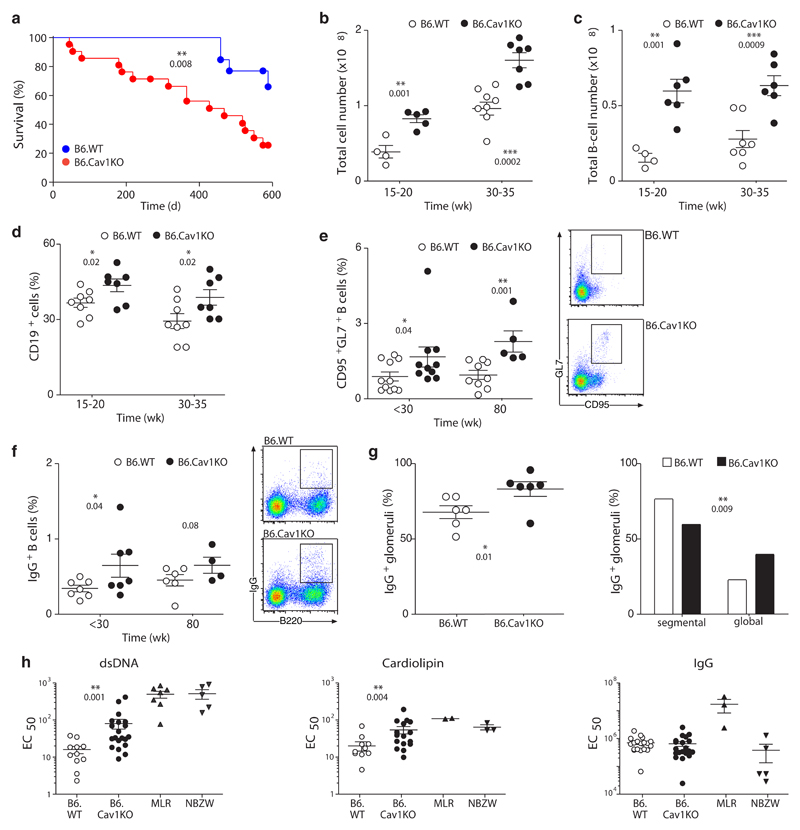
Figure 4. Increased B cell numbers, spontaneous GC formation, autoantibodies and reduced life span in B6.CavKO mice.
(a) Survival curves of B6.WT and B6.CavKO mice. The Log-rank (Mantel-Cox) Test was applied and the P value indicated. (b) The total number of splenocytes in B6.WT and B6.CavKO was calculated in adult mice (15-20 weeks) and in aged mice (30-35 weeks). (c) Total B cell numbers and (d) the relative proportions of B cells in the spleen. (e) Proportion of splenic GC B cells of untreated adult mice (<30 weeks) and very old mice (80 weeks). Representative dot plots are provided. (f) Proportion of splenic class-switched IgG1+ B cells. Representative dot plots are shown. (g) The kidneys of 80 weeks old mice were analyzed for the percent of glomeruli with IgG deposits (left). IgG+ glomeruli were further analyzed for segmental (<50%) or global (>50%) distribution of IgG. Chi-squared contingency analysis was done. (h) The presence of anti-dsDNA (left), anti-cardiolipin (middle) and total IgG-antibodies (right) in the serum of old mice (50-80 weeks) was assayed by ELISA. Serial dilutions of the serum were performed and the EC50 for each mouse calculated. As positive control, serum from autoimmune MLR/lpr and NBZW mice were used. Normal data distribution was tested using Kolmogorov-Smirnov test. Statistical analysis was done using Mann Whitney test. Each dot represents an individual animal. Statistical analysis was performed using Student’s t-test except in (h). Means ± SEM are shown. P values are indicated.

