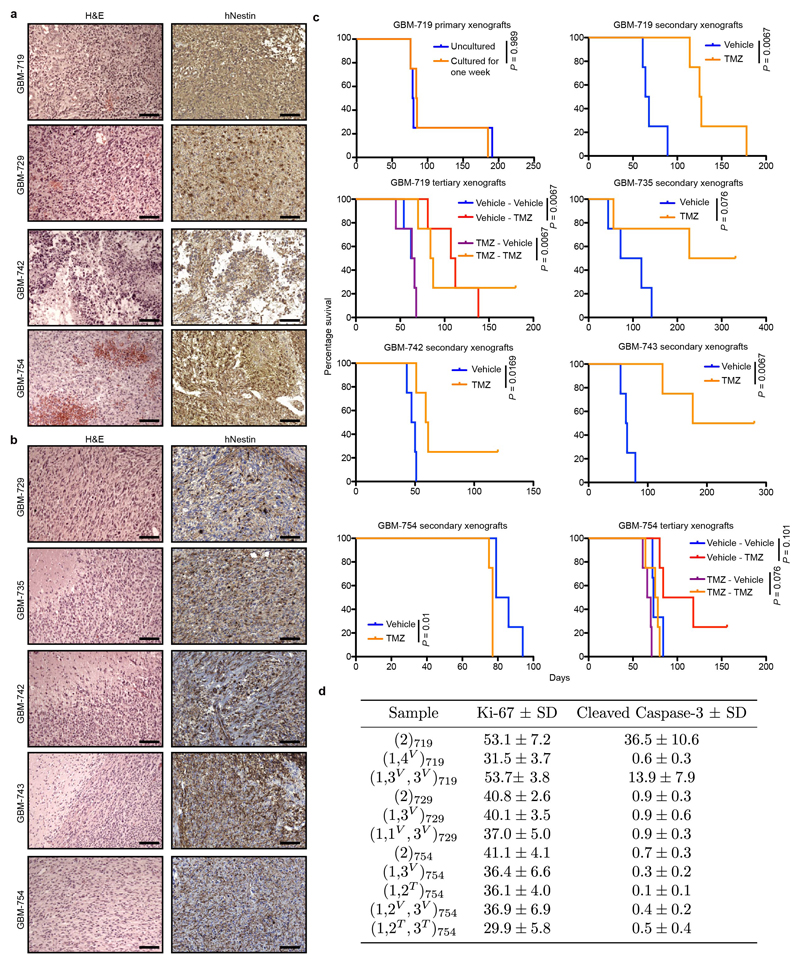
Extended data Figure 3. Functional characterization of GBMs and GBM xenografts.
a, H&E and human-specific nestin staining in primary glioblastoma specimens, scale bar = 100 µm. b, H&E and human-specific nestin staining for representative GBM xenografts, scale bar = 100 µm. c, Survival analysis of xenografts derived from the indicated GBM model and treatment conditions. All survival analyses were performed using a log-rank test (n = 4 mice per group with the exception of the GBM-754 experiment, Vehicle – Vehicle group which contains 3 mice). d, Quantification of percentage proliferative activity in serial xenografts by Ki-67 staining and percentage apoptosis by cleaved Caspase-3 staining, mean ± sd of 6 representative sections from the same xenograft sample.

