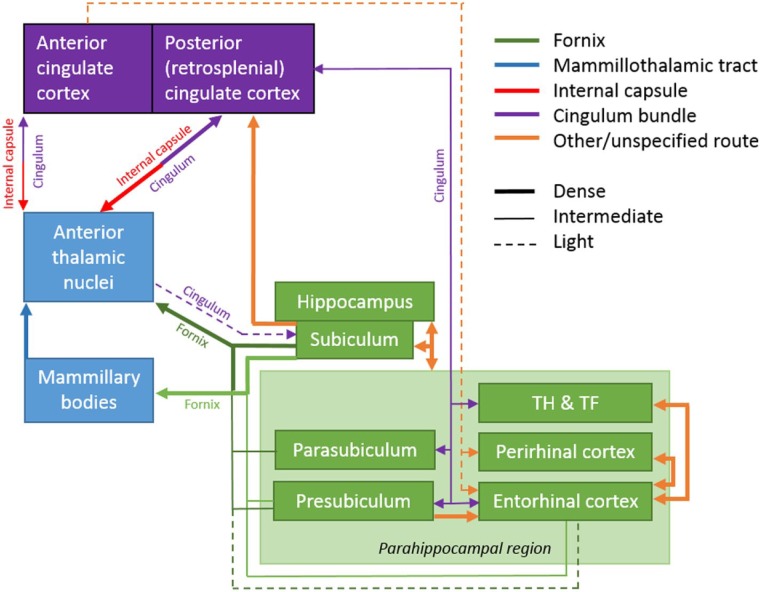
Figure 9.
Schematic showing the major interconnections of the hippocampal–diencephalic–cingulate network in the macaque monkey. In the case of some connections, two colours are used to show how they pass from one pathway to another. The style of the lines reflects the strength of the connections (thick line = dense, thin line = intermediate, dashed line = light).

