Figure 2.
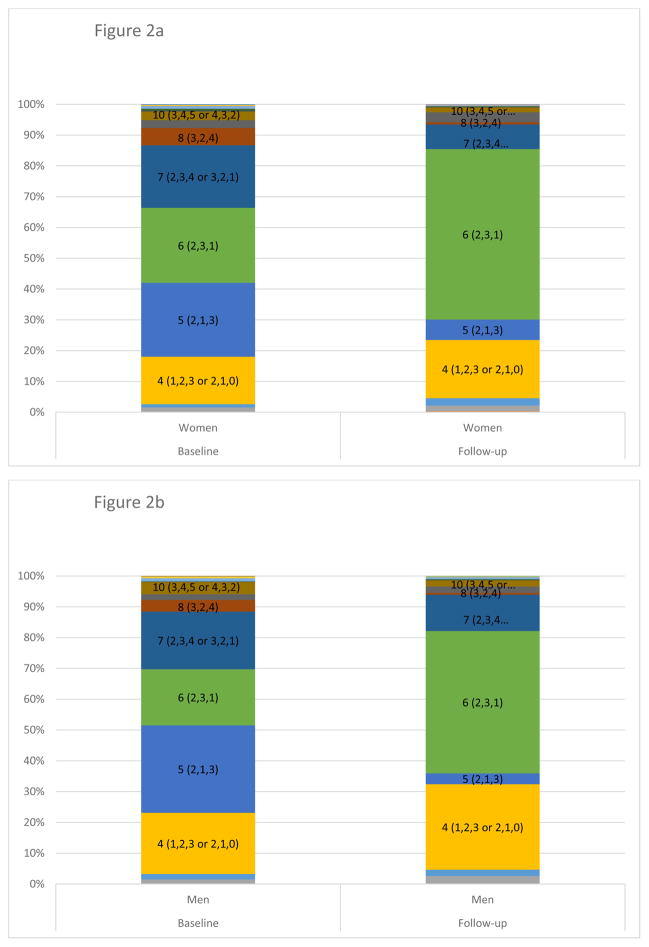
Figure 2a. Distribution of Coombs Scale (desired family size) responses for women at baseline and follow-up. Value with number of children preference in parentheses.
Figure 2b. Distribution of Coombs Scale (desired family size) responses for men at baseline and follow-up. Value with number of children preference in parentheses.

