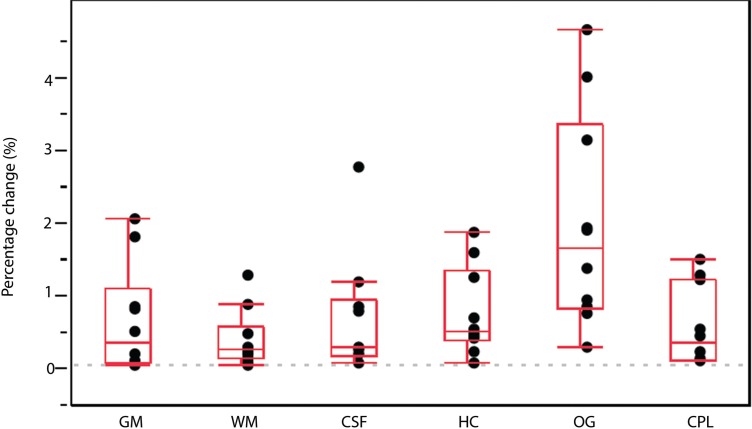
Fig. 1.
Repeatability with the atlas-based method. The percentage changes in each ROI are shown with the box plot. The box plot shows median, maximum, and minimum value below inner fence, first and third quartile, and outliers. Analysis of variance revealed a significant difference in average percentage change for all six regions (P < 0.05). In addition, the Tukey–Kramer method revealed significant difference (P < 0.05) for OG vs. GM, vs. WM, vs. CSF, vs. HC, and vs. CPL. The percentage change value was larger for OG than for all the other ROIs. CPL, cerebellum posterior lobe; CSF, cerebrospinal fluid; GM, gray matter; HC, hippocampus; OG, orbital gyrus; ROI, region-of-interest; WM, white matter.

