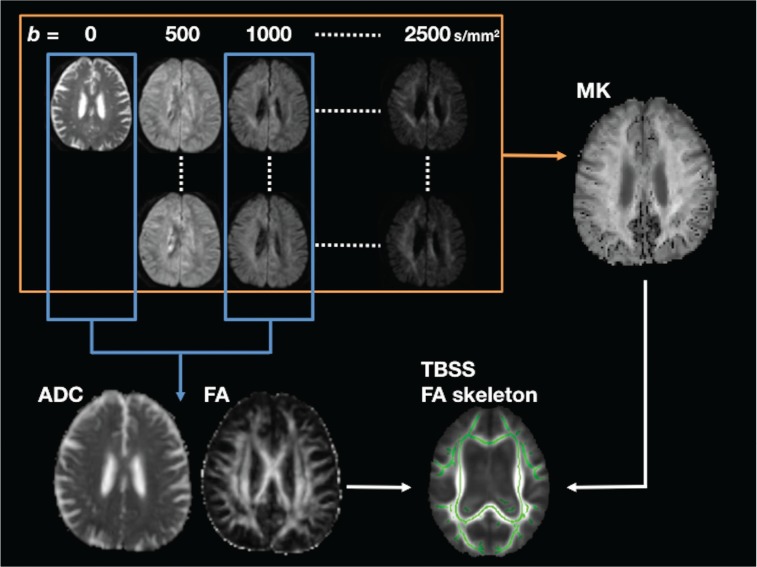
Fig. 1.
A flowchart of diffusion tensor imaging (DTI)/diffusional kurtosis imaging (DKI) image processing. The apparent diffusion coefficient (ADC) and fractional anisotropy (FA) maps were calculated by using b = 0 and b = 1000 s/mm2 data, while the entire data set was used for calculation of mean kurtosis (MK) maps. Following tract-based spatial statistics (TBSS) analyses of the FA maps, ADC and MK maps were also analyzed by applying the same transform as that for the FA maps (non-FA analyses function of TBSS).

