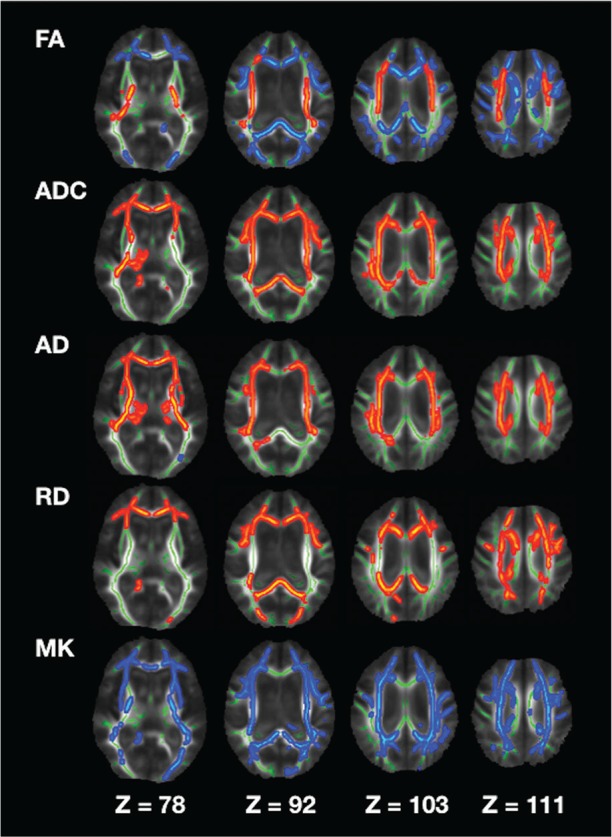
Fig. 3.

Comparison between the idiopathic normal pressure hydrocephalus (iNPH) patients and the controls. The areas with significantly increased values in the iNPH patients are marked with red-yellow, and the areas with significantly decreased values in the patients are marked with blue-light blue (P < 0.05, corrected for multiple comparisons). AD, axial diffusivity; ADC, apparent diffusion coefficient; FA, fractional anisotropy; MK, mean kurtosis; RD, radial diffusivity
