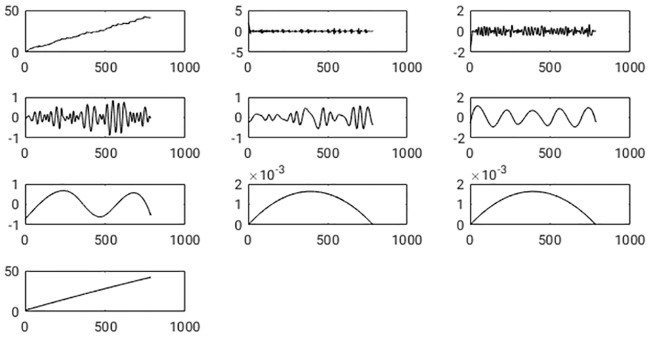
Fig 5. Shown is the spatial sensor position along one coordinate axis versus discrete time n ⋅ Ts with Ts the sampling interval and n = 1, …, T.
In the left corner of the top row, the original signal is exposed. The other boxes show the IMFs resulting from an EEMD. On the x-axis of each graph, the number of samples, and on the y-axis, the signal amplitude is plotted. The first IMF comes aside of the original signal, and subsequent IMFs follow in each row from left two right.

