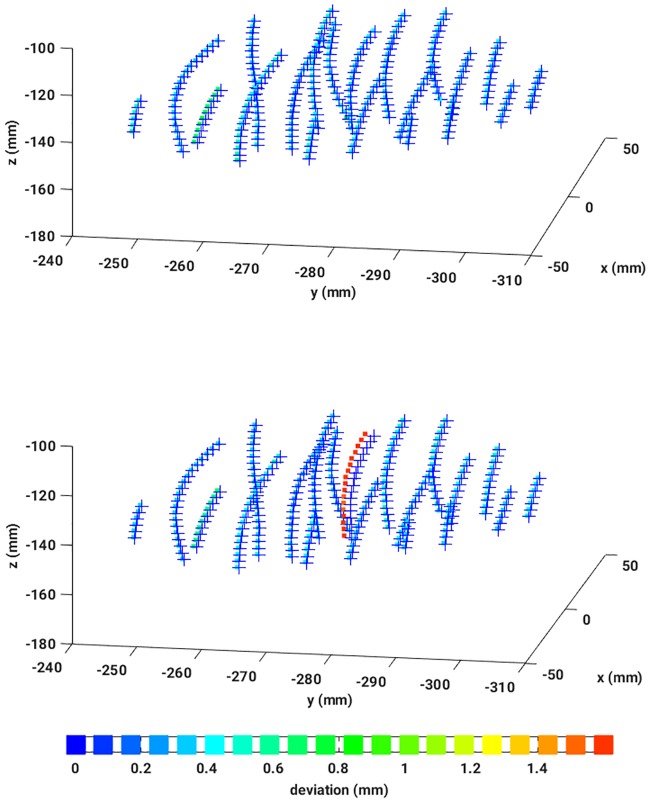
Fig 10.
Top: Illustration of a perfect reconstruction of the catheter shapes from EMT measurements of a patient immediately after the CT: 3D dwell positions from the treatment plan (crosses), 3D reconstructed EMT dwell positions, colored according to their absolute deviations from the treatment plan. Middle: Illustration of a clear catheter shift revealed by EMT data reconstructed according to the signal processing chain proposed in this work. The data stem from the same patient after it has been moved to the EMT treatment room. Crosses signify 3D dwell positions from the treatment plan, while 3D reconstructed EMT dwell positions are drawn as squares colored according to the absolute deviations of the dwell positions from the treatment plan. Bottom: Colorbar.

