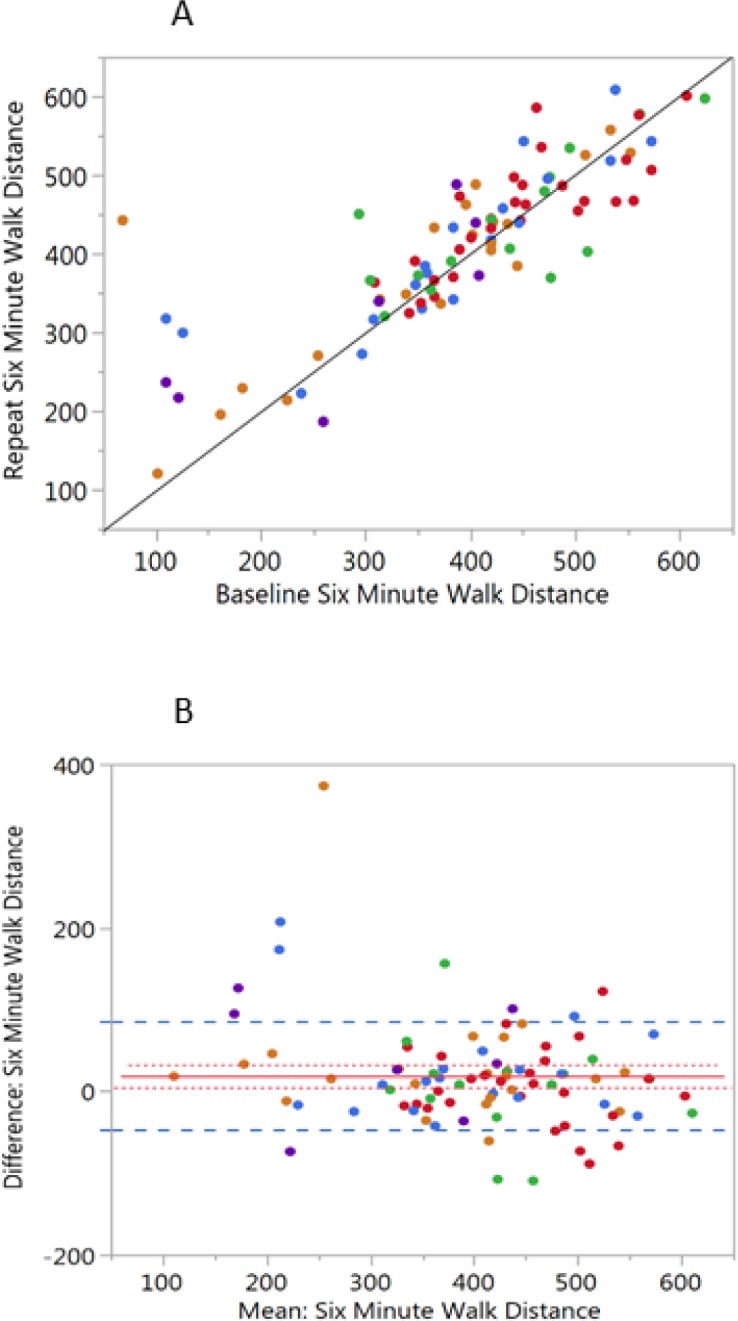
Fig 2. Six minute walk distance.

The subjects are color coded by GOLD classification as in Fig 1A) Scatterplot of the six-minute walk distance at the baseline and repeat visits (r = 0.829, p<0.0001; n = 92). The solid black line is drawn as a line of identity to visualize differences between the baseline and the repeat visits. B) Bland-Altman plot of the mean distance for each subject (baseline and repeat) by the difference between visits. The solid red line = the mean difference, the dotted red line is ± 1 SE and the Dashed blue line is ± 1 SD.
