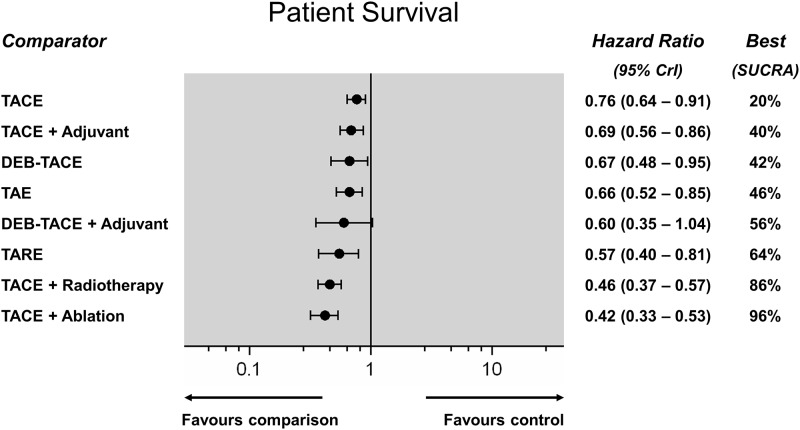
Fig 4. Patient survival network meta-analysis (Random effects forest plot).
Different treatments are reported in order of efficacy ranking according to the SUCRA statistic. Black circles denote the posterior median and the black lines denote the associated 95% CrI. Numbers represent hazard ratios (HR) and 95% CrIs. The combination of TACE and ablation was found to be the most effective treatment (SUCRA 95%).

