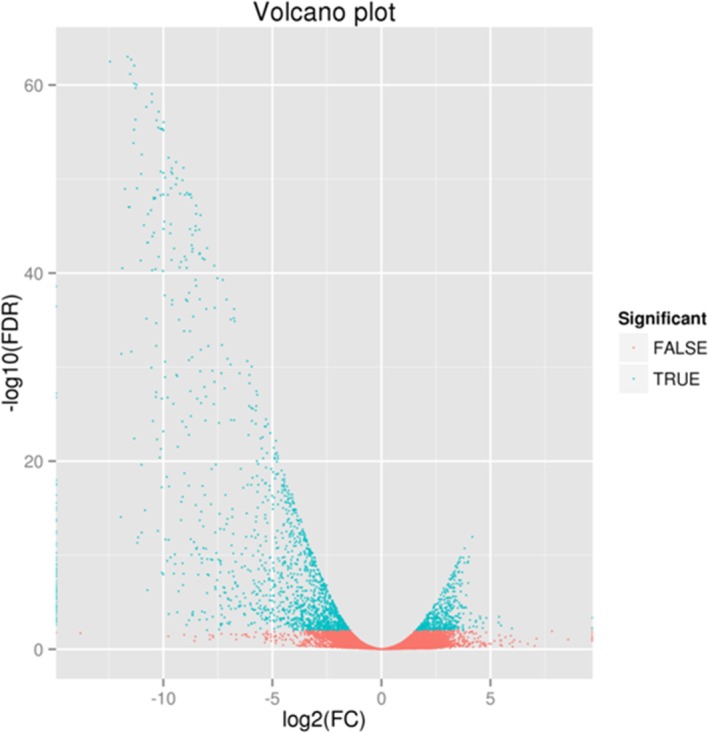
Fig 3. Volcano plot for group analysis of blood clams (T05 T08 versus T01 T02 T04).

We used specific criteria to identify the significance of differential expression: an FDR (False Discovery Rate)<0.01 and |log2FC (Fold Change)|≥1. The left side of 0 on the x-axis represents male-biased differentially expressed genes (DEGs) while the right side of 0 represents female-biased DEGs. The green region shows significant differences (an FDR<0.01), while the red region shows non-significant differences (an FDR≥0.01).
