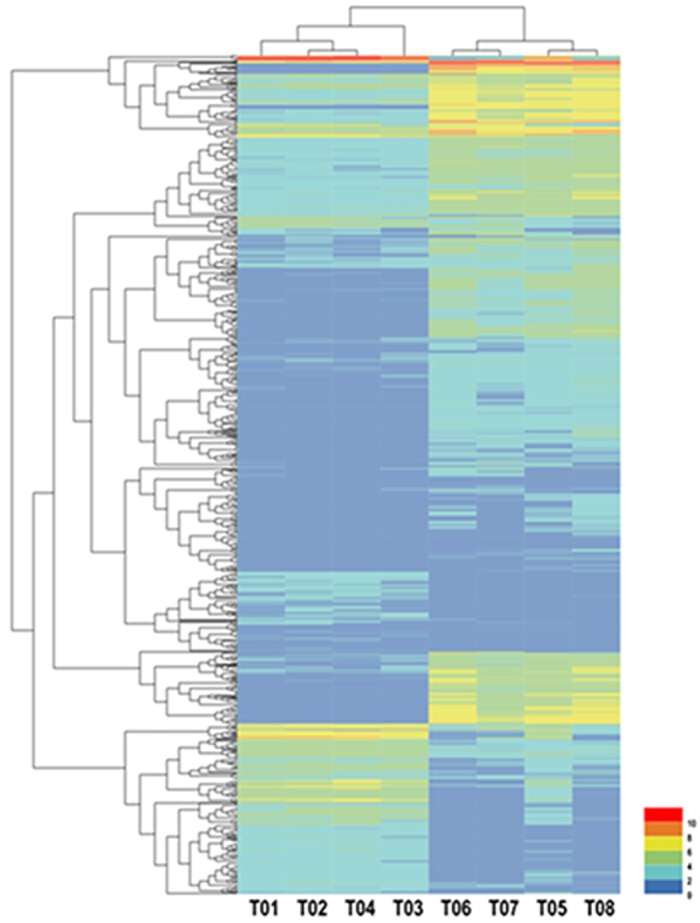
Fig 4. Hierarchical cluster analysis of blood clams (T01 T02 T03 T04 versus T05 T06 T07 T08).

Each column represents a sample, each row represents a gene, and each different color represents log2 (Fragments per kilobase of transcript per million mapped reads (FPKM)) to indicate different expression levels. The clustering branch indicates similarity between genes or samples.
