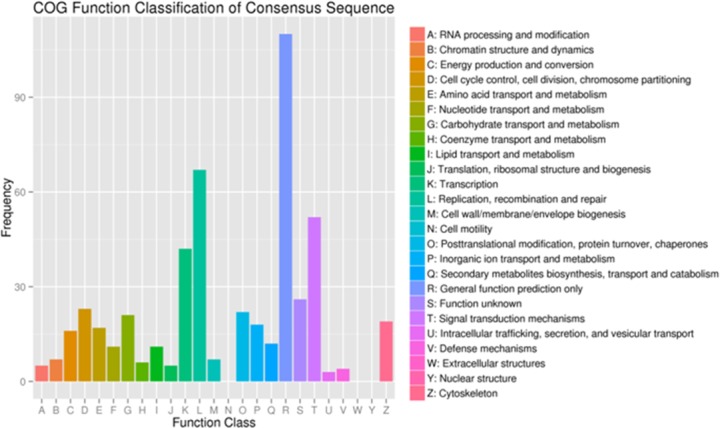
Fig 5. Cluster of Orthologous Groups (COG) functional classification of differentially expressed genes (DEGs) in blood clam (T05 T08 versus T01 T02 T04).

The x-axis shows 25 categories while the y-axis shows the number of DEGs corresponding to each category.
