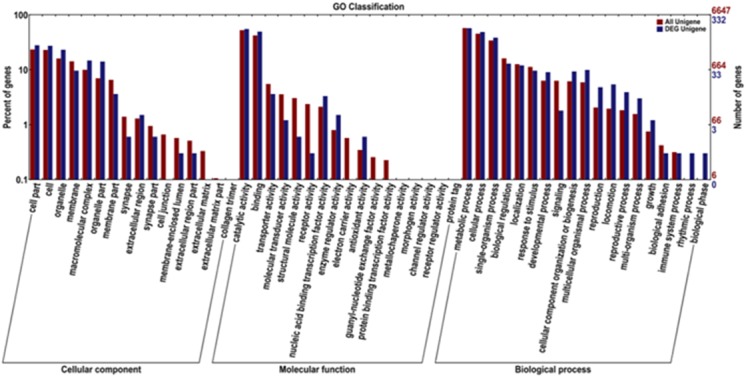
Fig 6. Gene Ontology (GO) functional classification of differentially expressed genes (DEGs) in blood clam (T05 T08 versus T01 T02 T04).

The x-axis shows three terms and 52 sub-terms while the y-axis shows the proportion of DEGs and unigenes corresponding to each subcategory. The red column represents annotation of all genes, while the blue column represents annotation of DEGs. Under the background of the total genes and DEGs, a term having a large number of DEGs may be related to sexual differences.
