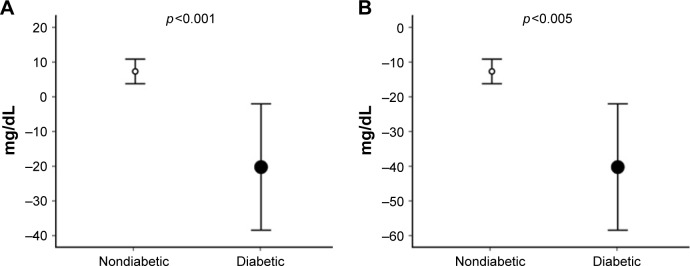
Figure 2.
Comparison of the magnitude of the intervention effect on blood glucose (calculated as Δ = post-intervention value − pre-intervention value) between groups, presented with corresponding SD.
Notes: (A) Strength training intervention. (B) Cardiovascular intervention.
Abbreviation: SD, standard deviation.

