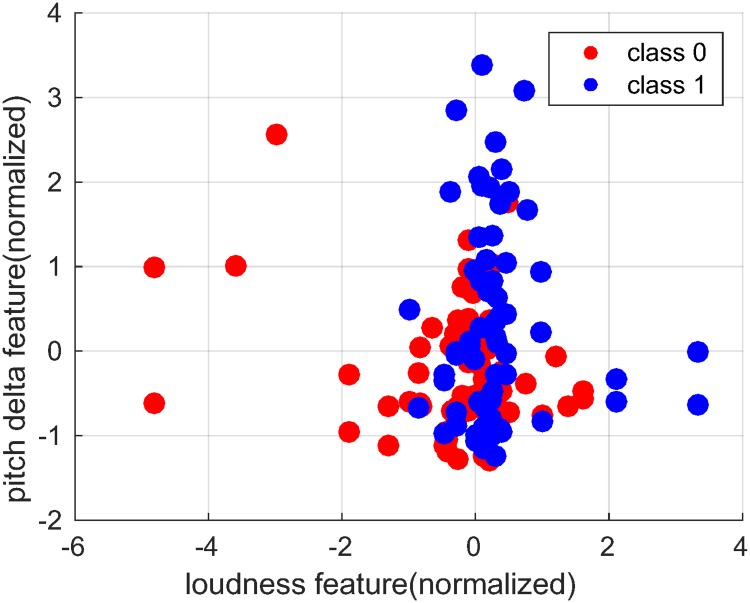
Fig 3. Scatter plot of two prosodic features(normalized) with highest correlation: Loudness (r = 0.2983) and pitch delta (r = 0.2772).
The corresponding static functionals are standard deviation and mean, in respective order. Class 0 and class 1 represent respectively no recovery and recovery cases.

