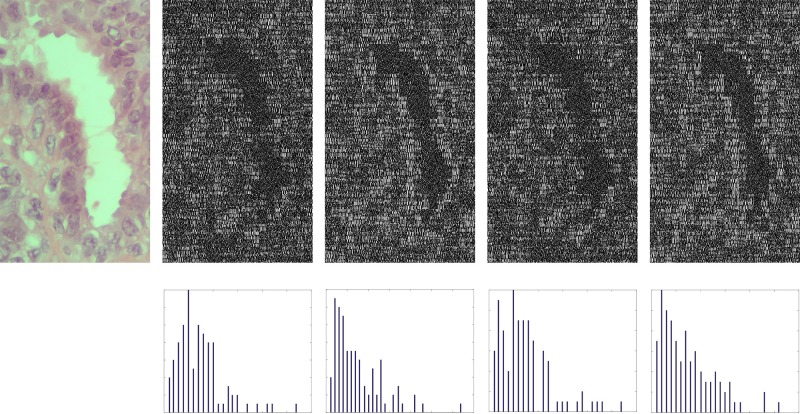
Fig 5.
(a) An indicative portion of a histological image consisting of 32x16 patches. Each image patch is modeled by four higher-order linear dynamical systems corresponding to the four possible directions of the signal’s evolution. Figures (b)-(e) illustrate the stabilized transition matrices of each patch in the four directions, i.e., (b) right, (c) up, (d) left, and (e) down. Figures (f)-(i) illustrate the corresponding histograms of the stabilized higher–order LDS descriptors.

