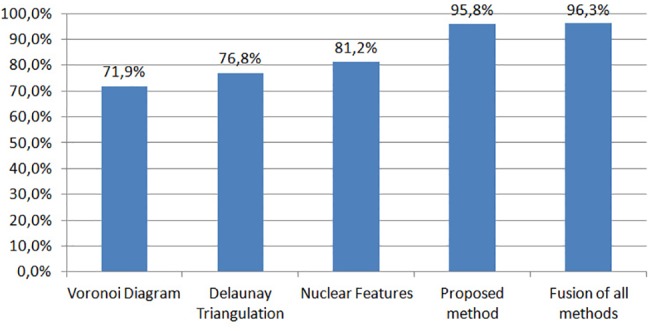
Fig 8. Comparison of the proposed method against two graph-based approaches, i.e., Voronoi diagram and Delaunay triangulation and a method based on various nuclear features.

The last classification rate corresponds to the fusion of the proposed method with the three other approaches.
