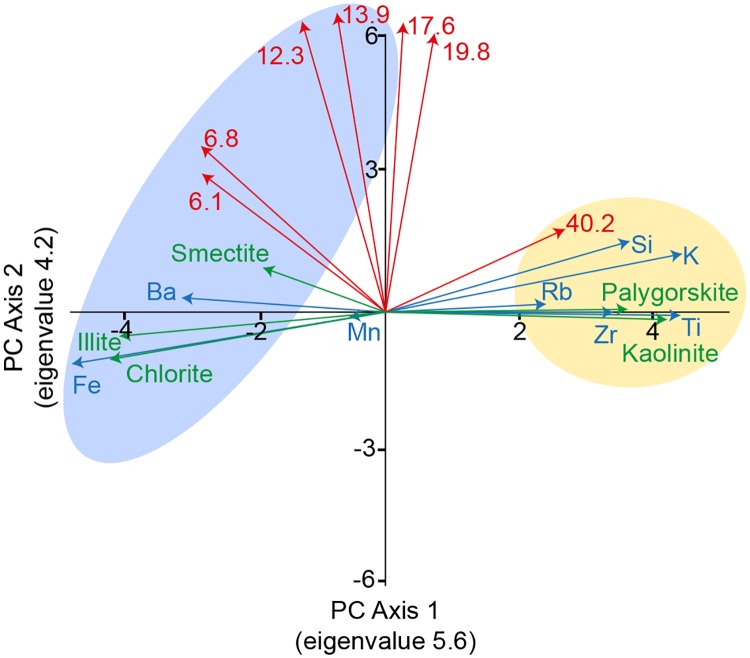
Fig 7. Results of the PCA of the combined dataset.
The results for the grain size data are presented in red (numbers indicate grain size classes), the results for the clay mineral data are presented in green, and the results for the XRF data are presented in blue. Sediment parameters indicating Saharan dust are shaded in yellow, and the sediment parameters indicating fluviatile sediment influx are shaded in light blue. The eigenvalues of the PC axes are included in brackets.

