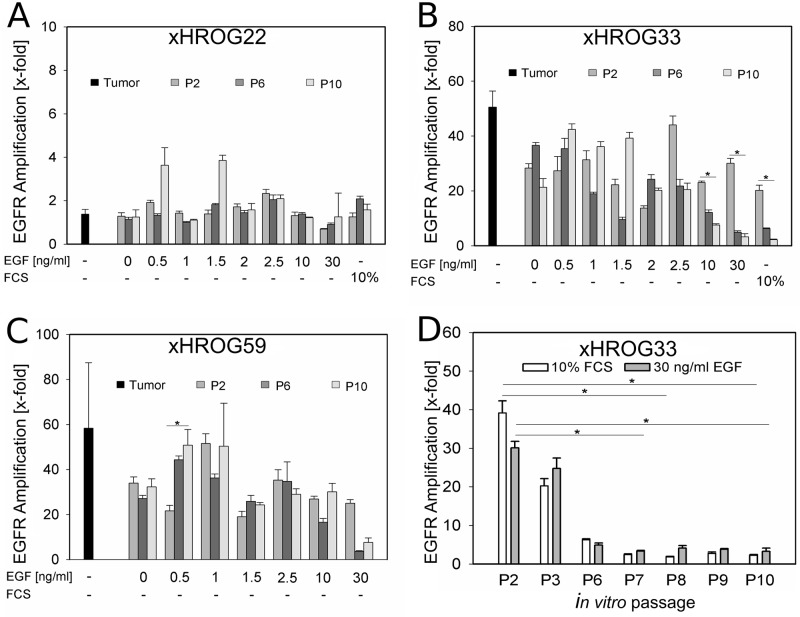
Fig 2. EGFR amplification is maintained over several in vitro passages, but lost in the 10% FCS control and with high EGF concentrations.
qPCR analysis of A) xHROG22, B) xHROG33, C) x HROG59 cell lines grown under all culture conditions at passage 2 (grey bars), passage 6 (dark grey bars) and passage 10 (light grey bars). Black bars represent the respective PDX prior to cell culture establishment. D) qPCR analysis of the 10% FCS control (white bars) and the 30 ng/ml EGF cell line (grey bars) of xHROG33 over several in vitro passages. Error bars represent the standard deviation of triplicate analyses. * p<0.05, Tukey test.

