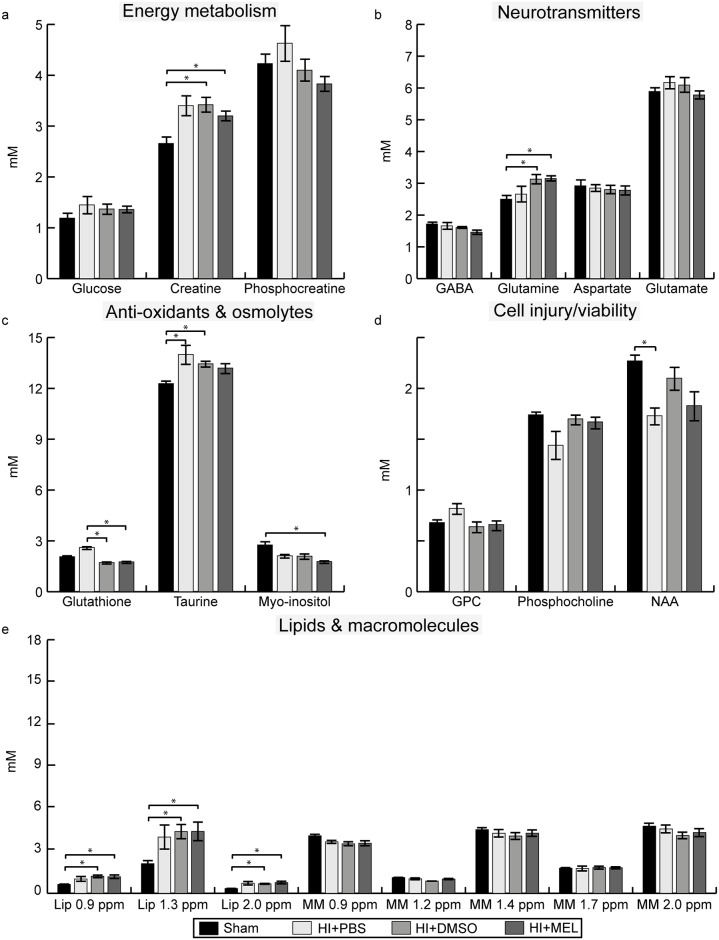
Fig 5. Metabolite concentrations in the contralateral thalamus within 1 day after HI.
Concentrations of (a) energy metabolites, (b) neurotransmitters, (c) anti-oxidants and osmolytes, (d) metabolites representing cell injury/viability and (e) lipids and macromolecules in HI animals exposed to PBS, DMSO or melatonin (MEL) treatment and sham animals (here presented as one group). Results are presented as mean ± SEM. * significant differences between groups. GPC glycerophosphocholine; HI, hypoxia-ischemia; Lip, lipids; MM, macromolecules; NAA, N-acetyl aspartate; ppm, parts per million; sham, sham-operated.

