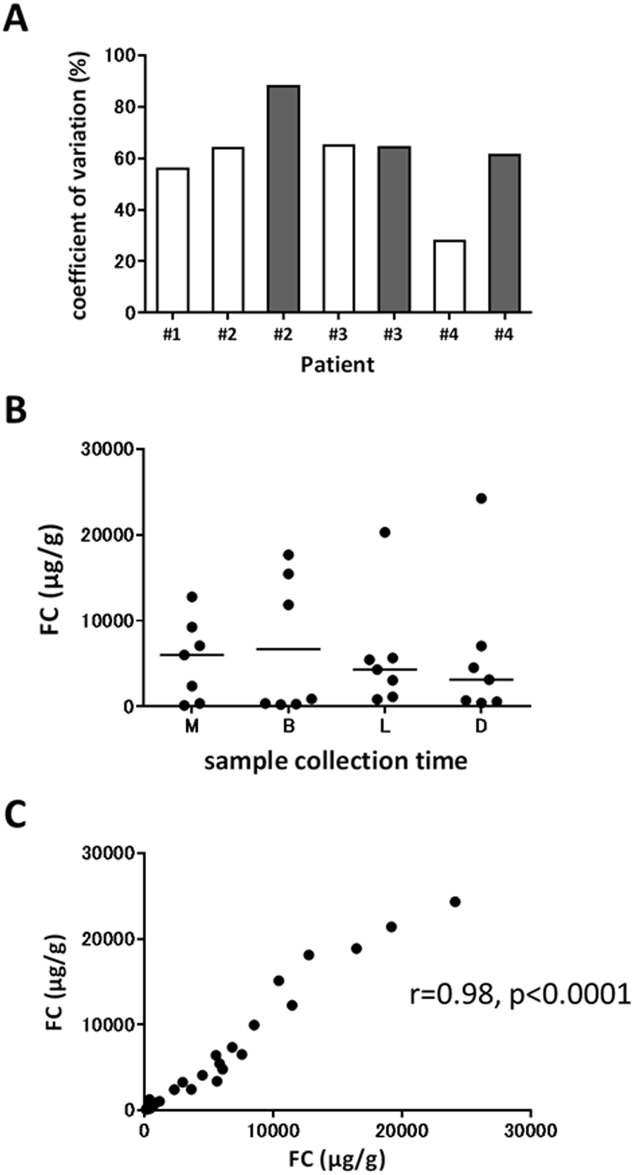
Fig 4.
(A) Within-day variability of fecal calprotectin (FC) in 4 patients with active UC. Three of 4 patients provided fecal samples before (open box) and a week after remission induction treatment (filled box). (B) FC at different times in a single day. (C) Correlation between 2 samples collected from different parts of each feces. Statistical significance in FC among sample collection times was determined by Friedman’s test with post-hoc analysis of Dunn’s multiple comparison test. Pearson’s correlation coefficient was used to analyze correlation in FC between 2 separate samples from each feces. M, morning; B, breakfast; L, lunch; D, dinner.

