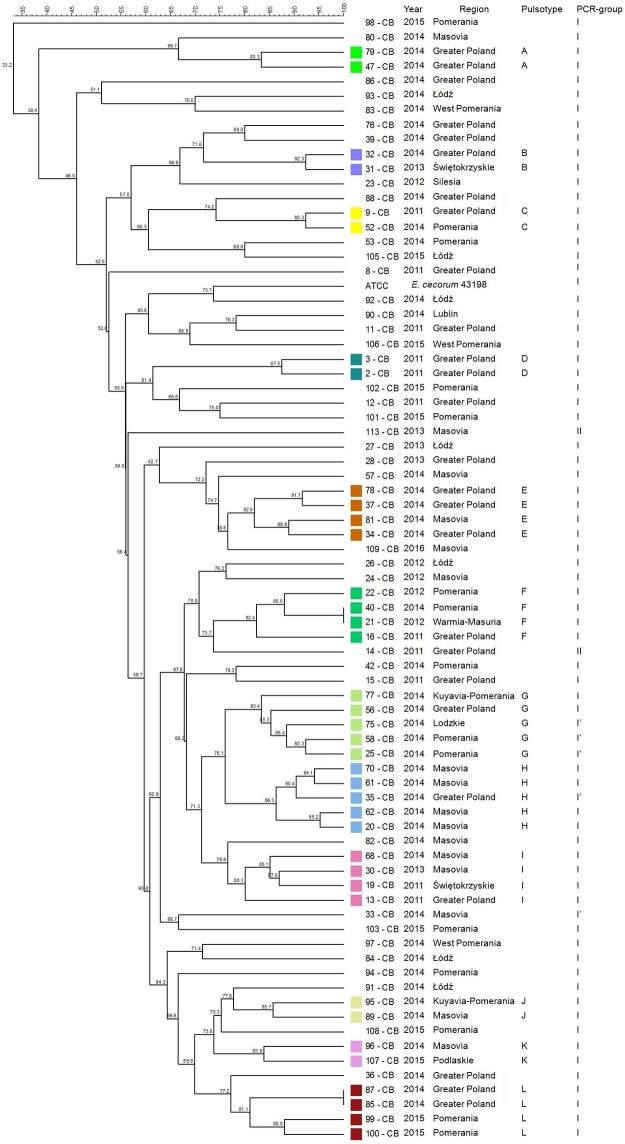
Fig 2. Tree showing the genetic similarity between pathogenic E. cecorum isolates from 76 broiler chickens flocks (CB) based on PFGE (SmaI) and PCR results (sequences of sodA gene fragment).
The each pulsotype is shown with the corresponding number of isolate, year of isolation, location of affected flock, and PCR-group (sodA). Analysis revealed 2 phylogenetic groups (I–II, and I’ subgroup), and 12 (A–L) individual pulsotypes comprised 38 CB isolates. Dendogram was constructed based on the Dice similarity coefficient and the UPGMA clustering method. Enterococcus cecorum ATCC 43198 was used as a reference strain.

