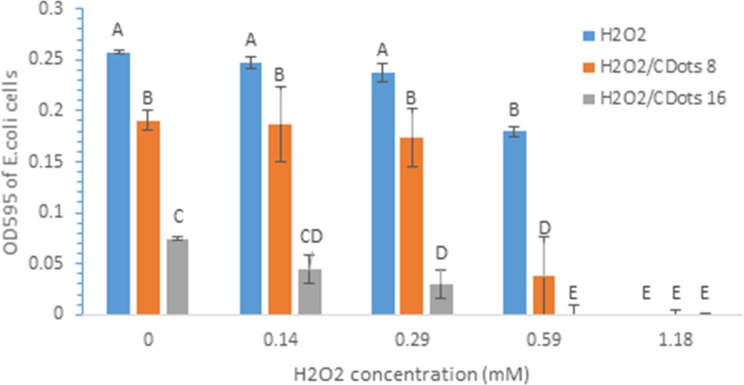
Fig 2. Inhibitory effects of H2O2 alone and H2O2/CDots combination on E. coli cells.
CDots concentration was 8 μg/mL or 16 μg/mL. Bacterial cell growth was measured by OD value at wavelength 595 nm. Data is presented by the mean of 3–5 replicated samples and Error bars are ±SD of the replicated measurements. Different letters above the columns indicate statistically significant differences (p<0.05).

