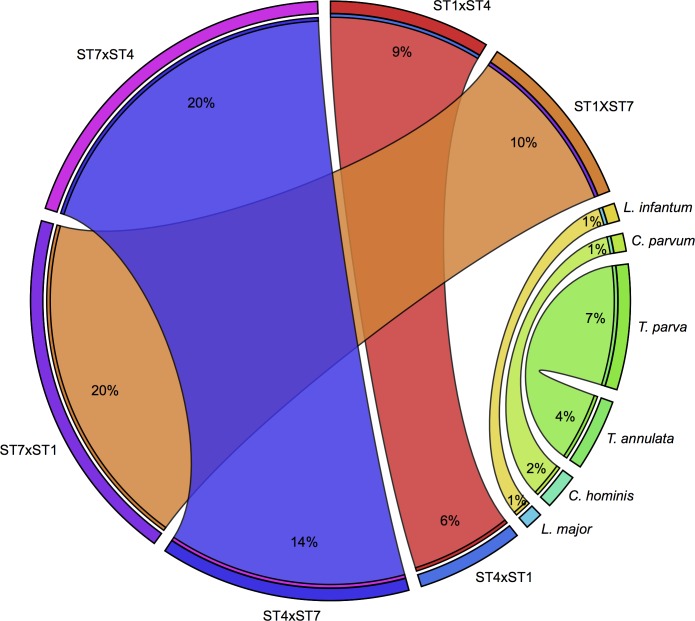
Fig 3. A comparison of unique genes between Blastocystis subtype (ST) pairs to pairs of protistan pathogens.
The percentage of an organism’s protein-coding gene set, which is unique when compared to another organism’s protein-coding gene set and vice versa, is denoted by the width of the ribbon between the 2 as well as being indicated on the ribbon. For example, in a comparison between ST7 and ST1, 20% of the genes in ST7 are not represented in the ST1 set, while 10% of ST1's genes are not found in ST7. Comparisons are based on BLASTp results with an expect value (e-value) threshold of 1e-30 and >50% coverage of the query. Abbreviations: C., Cryptosporidium; L., Leishmania; T., Theileria. Plots were generated using Circos.

