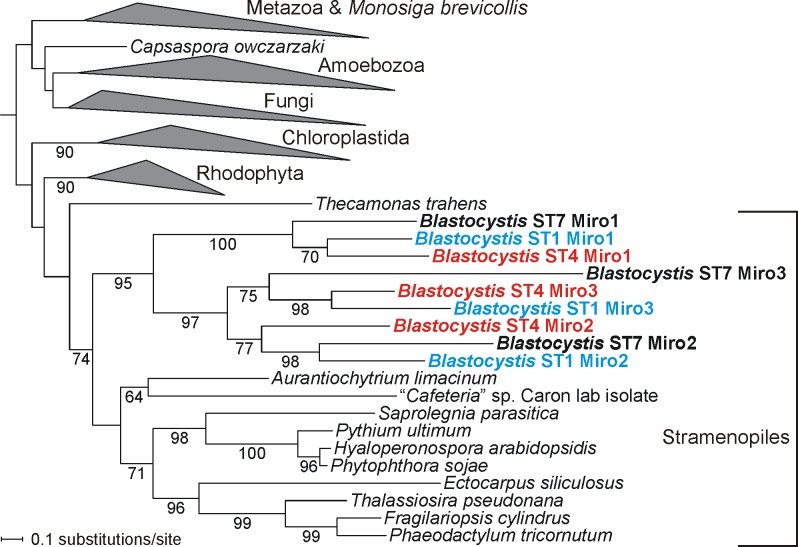
Fig 8. Maximum likelihood phylogenetic tree of Miro protein sequences.
The tree was calculated using Randomized Axelerated Maximum Likelihood (RAxML). Bootstrap support values above 50% are shown at branches. For simplicity, clades comprising sequences from major monophyletic groups of eukaryotes were collapsed, displaying in detail only the clade of sequences from stramenopiles. Note the 3 Miro paralogs that have apparently emerged from Blastocystis-specific gene duplications before the divergence of the ST1, ST4, and ST7 lineages (gene identifiers of the Blastocystis Miro sequences are provided in S4 Data).

