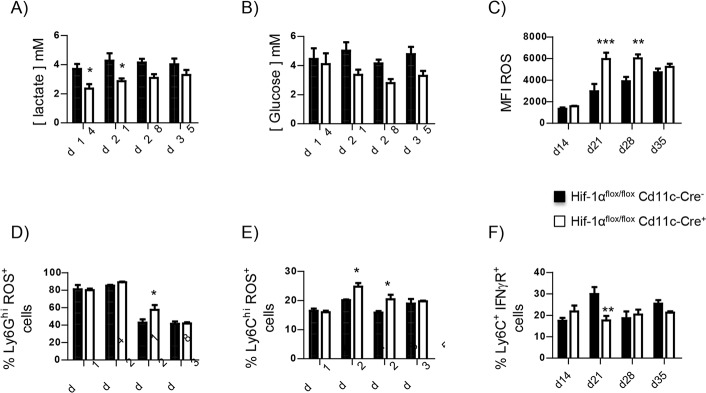
Fig 5. HIF-1α governs glucose metabolism in L. donovani infected splenocytes.
Hifflox/flox-Cd11c-Cre+ and Cre- mice were infected with L. donovani and sacrificed at various time point of infection. (A) Intracellular lactate concentration and (B) intracellular glucose concentration in splenocytes from infected mice at various time points of infection. (C) Mean fluorescence intensity of ROS expression in splenocytes from infected mice over the course of infection. (D) Percentage of ROS+ neutrophils. (E) Percentage of ROS+ Ly6Chi monocytes. (F) Frequency of CD11bhiLy6C+ splenocytes expressing IFNγR. All data represent mean ± SEM of one of 4 independent experiments, n = 4. * denotes p<0.05, ** denotes p<0.01, and *** denotes p<0.001

