
Figure 4.
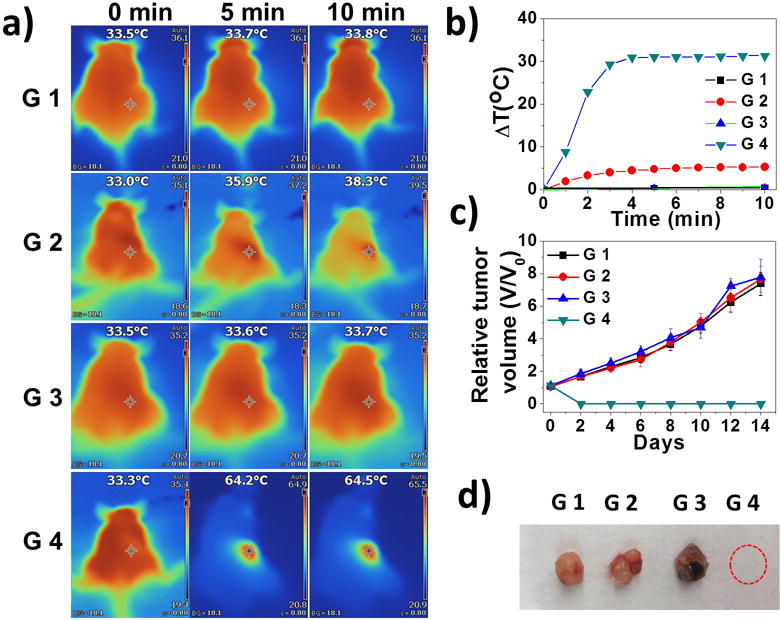
a) IR images of MCF-7 tumor-bearing mice (G1: Saline; G2: only NIR; G3: only PEG-coated AMQDs; G4: PEG-coated AMQDs + NIR; 808 nm, 1 W cm−2). b) Temperature changes at tumor sites. c) Relative tumor volumes after various treatments. d) Representative images of harvested tumors from each group at day 14.