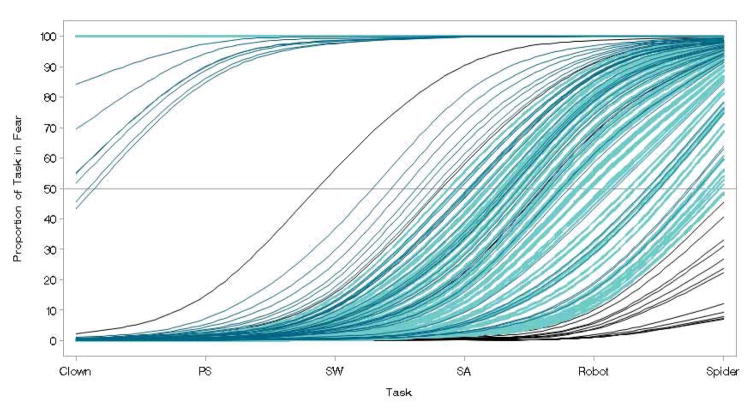
Figure 1.
Plot of Expected Fear Behavior Derived from Nonlinear Growth Model with a Fear Sensitivity Parameter
Note: Curves represent individual’s expected display of fear across tasks with successively greater levels of threat. Individual differences in fear sensitivity derived from the λi parameters of Equation estimates. PS = Puppet Show, SA = Stranger Approach, SW = Stranger Working.

