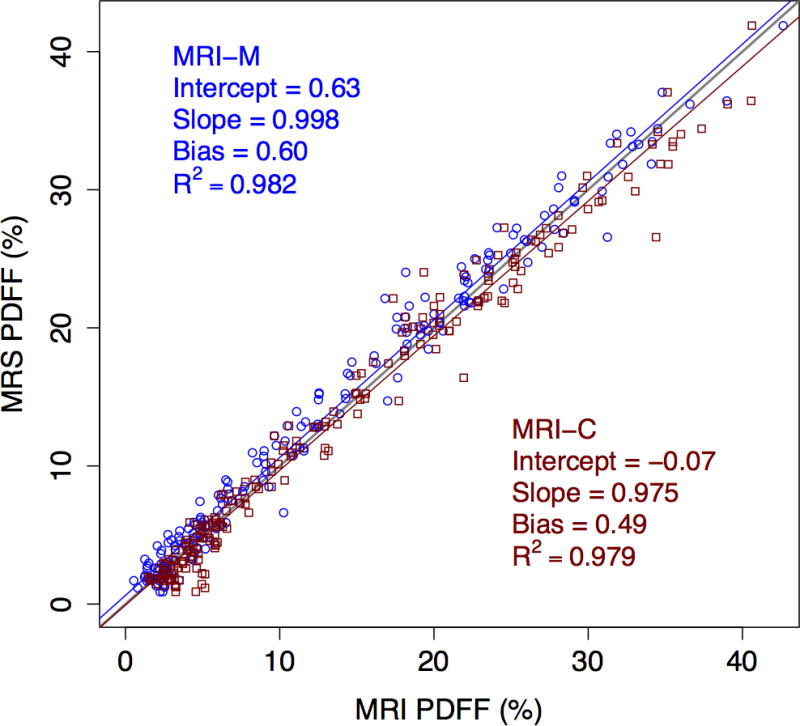
Figure 2.

Scatter plot showing accuracy of the two MRI methods for PDFF quantification, using MRS as reference standard. MRI-M regression line and data points are blue circles, and MRI-C regression line and data points are red squares.

Scatter plot showing accuracy of the two MRI methods for PDFF quantification, using MRS as reference standard. MRI-M regression line and data points are blue circles, and MRI-C regression line and data points are red squares.