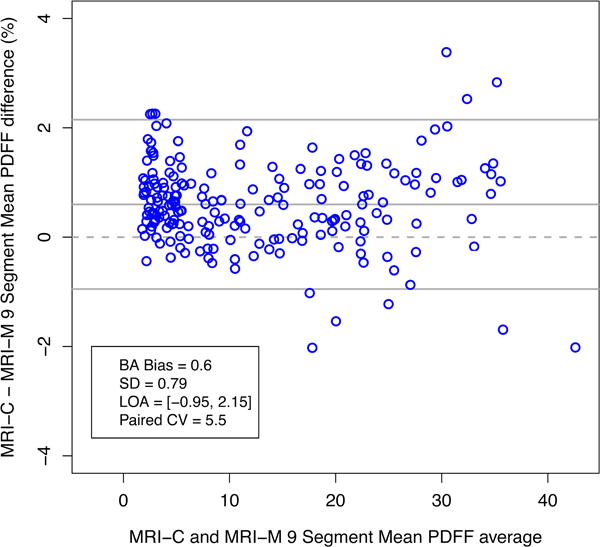
Figure 3.

Bland-Altman plot showing agreement of MRI-M with MRI-C for 9-segment average PDFF. The difference between PDFF estimated by MRI-M and MRI-C is plotted on the y-axis, and the average of the PDFF values estimated by the two MRI methods is plotted on the x-axis.
