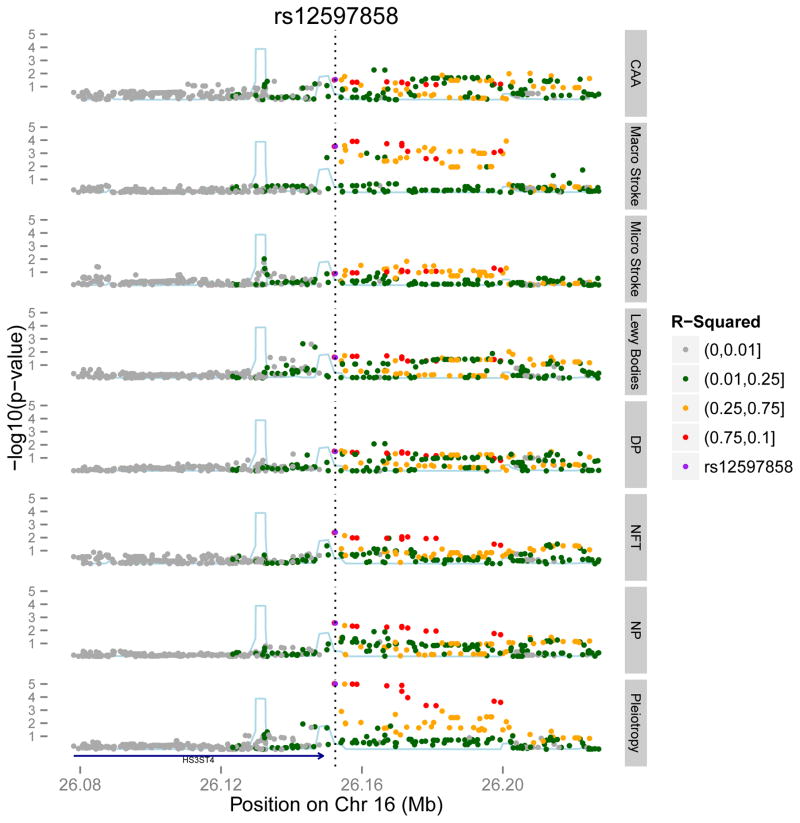
Figure 3. Regional association plot for HS3ST4.
The x-axis is the base pair position centered around the top pleiotropy snp, rs12597858 and the y-axis is the −log(p-value). The blue line represents the recombination rate. The bottom level shows the pleiotropic results and the top level show results for each of the seven neuropathological phenotypes.

