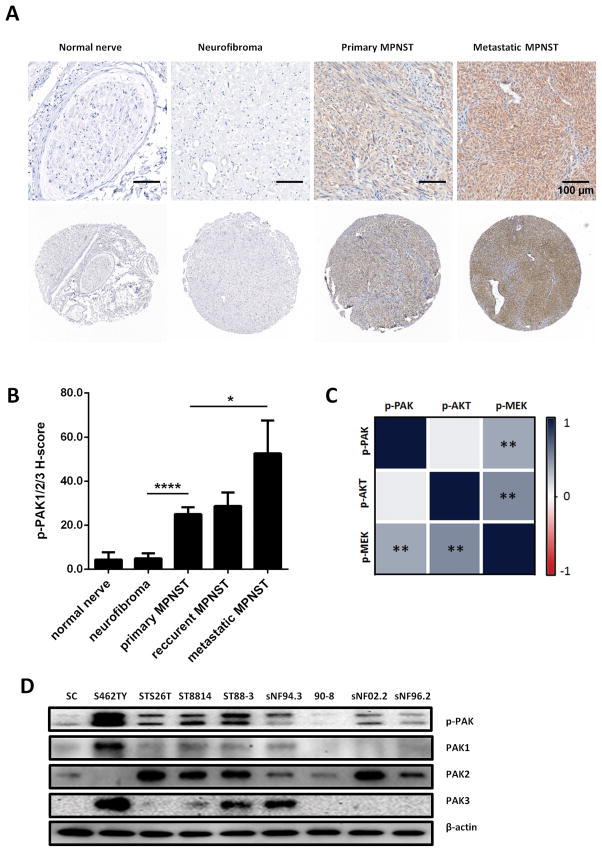
Figure 1. Phospho-PAK1/2/3 is present at high levels in human MPNST specimens and human MPNST cell lines.
A, Representative photographs of MPNST tissue microarray (TMA), IHC stained for phospho-PAK1/2/3. B. Quantification of phospho-PAK1/2/3 staining intensity in MPNST TMA. C. Expression correlations between phospho-PAK1/2/3, phospho-MEK and phospho-AKT, increasing saturation of blue indicates higher correlation. D. Immunoblot analysis demonstrating Group I Pak protein and phospho-protein levels in human Schwann cells (SC) and human MPNST cell lines. Error bars represent standard error of the mean (*= p<0.05, **= p<0.001, ****= p<0.0001).

