Figure 5.
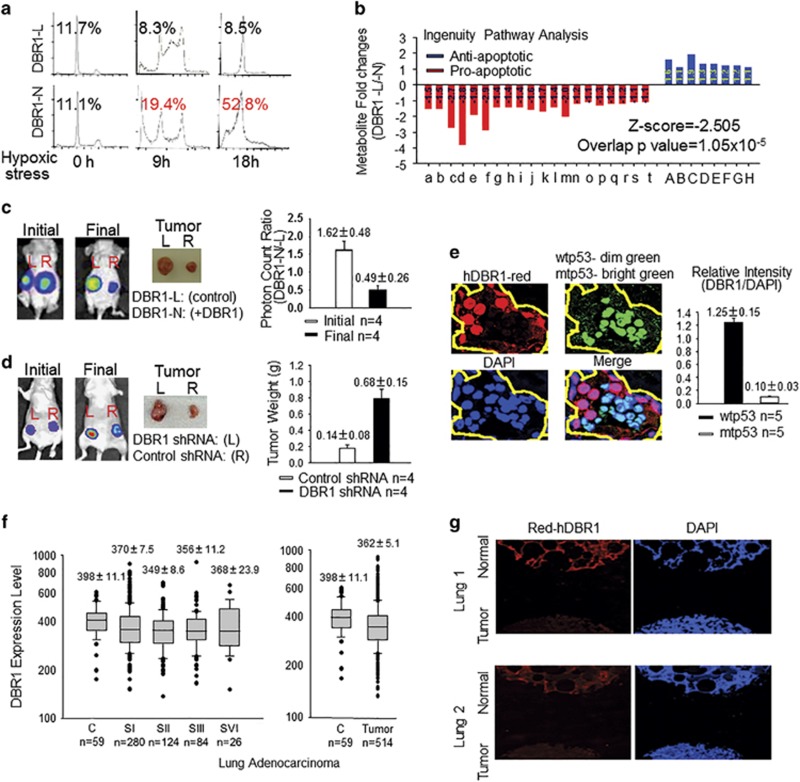
hDBR1 contributes to p53 tumor-suppressor activity. (a) The sub-G1 percentage was clearly lower in DBR1-L cells than in DBR1-N cells. (b) The same set of cells (Supplementary Figure S3a) was subsequently prepared for metabolomics analysis. Nonparametric statistical analyses were used to screen the metabolites that were significantly different between the two groups (P<0.05). An ingenuity pathway analysis (IPA) showed that a lower level of apoptotic activity occurred in DBR1-L cells (Z-score=−2.505, overlapping P-value=1.05 × 10⁻⁵) (for the list of metabolites, see Supplementary Table S4). (c, d) DBR1-L and DBR1-N cells, or A549 control and DBR1-silenced cells (Supplementary Figure S3d) were used for xenograft analyses performed in groups of four nude mice. The xenografts generated from DBR1-N cells or A549 control cells grew much slower than the corresponding xenografts derived from DBR1-L cells or A549 DBR1-silenced cells, respectively. (P=0.00616 and 0.00481, respectively). (e) A higher level of hDBR1 expression was associated with wtp53 status in situ in human ovarian cancer. The fluorescence intensity was measured with ImageJ (NIH, Bethesda, MD, USA) (P=0.00000018). (The images were taken in the same microscopic field at a magnification of × 600). (f) Through the analysis of gene expression data sets for DBR1 expression in lung adenocarcinoma from the TCGA database (http://gdac.broadinstitute.org/), we found that tumor tissues generally have a lower level of DBR1 expression than para-carcinoma non-malignant tissues. However, there is no significant difference between different stages of malignant tumors. The results are presented as the mean±s.e., P=0.022. (g) The level of hDBR1 protein expression was detected using immunofluorescence in a lung tissue array that included a total of 24 cases. In 20 of these lung cancer cases, the level of hDBR1 expression was low compared with that in the four benign samples. (Images were acquired in the same microscopic field at a magnification of × 40).

