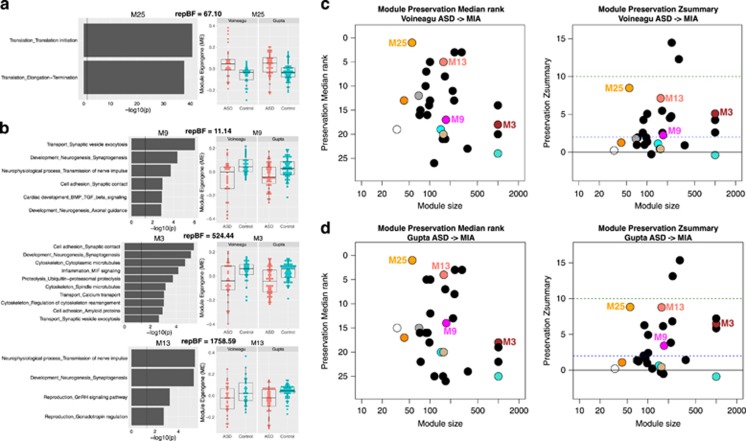
Figure 3.
Preservation of dysregulated gene co-expression network organization across maternal immune activation (MIA) and autism spectrum disorder (ASD). This figure shows ASD co-expression modules that are replicably dysregulated in ASD and preserved in network-level structure in the MIA dataset. Panels a and b depict gene co-expression modules that are replicably upregulated (a) or downregulated (b) in ASD cortical gene expression datasets. Scatter-boxplots show module eigengene (ME) expression levels with individual dots for each sample and boxplots that show the median and interquartile range (IQR; Q1=25th percentile, Q3=75th percentile), as well as the outer fences (Q1–(1.5IQR) and Q3+(1.5IQR)). Next to each scatter-boxplot are results from process level enrichment analysis on each module. Above these plots are replication Bayes Factor statistics indicating evidence in favor of replication (repBF>10 indicates strong evidence in favor of replication). Panels c and d show module preservation statistics (median rank and Zsummary) for preservation between ASD cortical gene modules (c, Voineagu dataset; d, Gupta dataset) and MIA gene modules. The horizontal lines on the preservation Zsummary plot indicate categories for evidence of preservation, with Zsummary statistics between 2 and 10 indicating ‘moderate’ evidence for preservation. Modules represented by black dots are not differentially expressed between ASD and Control brains. Modules represented by colored dots (not black) and without a specific number (e.g. M25) are differentially expressed but not significantly preserved between ASD and MIA. Colored modules M25, M13, M3 and M9 are differentially expressed and significantly preserved between ASD and MIA.

